Per Discussion Analytics Drill Downs
You can now get analytics insights and metrics on individual discussions. Understand how engaged community members are with a specific post, see how important announcements are received, and how ideas trend overtime using a dashboard that shows you how many views it has gotten, who is participating, and how users are reacting to it.
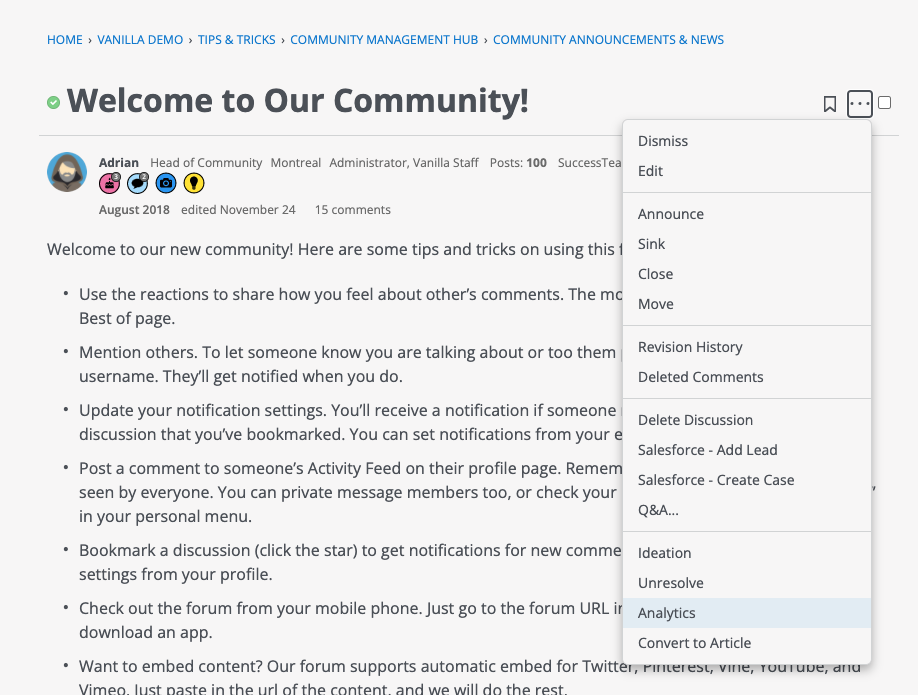
To access the report for a specific post, use the Analytics option in the thread's options menu.
By default, the dashboard will show you the last 30 days worth of data. Use the data filter to expand or narrow down the timeframe.

Available metrics include:
- # of comments
- Participants
- Viewers
- Pageviews
- Reactions received
- Participation rate per role-type
Per Article Analytics Drill Downs
You can now get deeper insights on individual articles in your KB. Using our per-article analytics dashboard you can not better understand who has viewed a knowledge article, or your latest release notes and understand if users have rated the content as helpful or not.
To access per-article dashboards, use the Analytics options in the article's options menu.

By default, the dashboard will show you the last 30 days worth of data. Use the data filter to expand or narrow down the timeframe.

Available metrics include:
- Pageviews
- Viewers
- Article Feedback responses to "Was this article helpful?"